Sami Prehistory Revisited: transactions, admixture and assimilation in the phylogeographic picture of Scandinavia
John Weinstock, University of Texas
Introduction
The origin of the Sami people has long been a contentious issue. Scholarly views run the gamut from the Sami’s forebears as the original inhabitants of Fennoscandia to their arrival as recently as a few centuries ago. In a paper last year I showed that today’s Sami population of Scandinavia is genetically heterogeneous.[1] Though there were migrations into the area after the Last Glacial Maximum, they were from many directions, along different routes and at various times and rates depending on where the glaciers disappeared earliest, ecological factors and the nature of the flora and fauna. The goal of the present effort is to broaden the focus, to consider in more detail the archaeological, climatological, linguistic and genetic data for all of the Nordic countries and to take up such questions as to how the post-glacial settlement of Fennoscandia occurred and how it affected the current majority populations of Finns, Norwegians and Swedes. A clearer archaeological picture with new sites has begun to emerge. And with the rapidly evolving field of human genetics there are always new analyses based on better data and more powerful sequencing: last year’s sensation is today’s relic.
One consideration to keep in mind is that humans have generally been gregarious in nature: when members of one group meet strangers, they trade, they borrow words, ideas or technologies from one another, they intermarry and they often exchange genes. Such cultural contacts can be seen, for example, in the Venus figurines widespread over Central and Eastern Europe after 30,000 years ago (Hoffecker 2005a: 87). Social networks were much larger than one might think. Another consideration when dealing with today’s Nordic peoples is that they are defined primarily on the basis of ethnicity, especially mother tongue. In the case of the Sami this leads to problems, since most of the available Sami genetic data were sampled from those who consider themselves to be Sami.[2] Not included are the many “Sami” who were assimilated by the nation-states in the 19th and first half of the 20th century and who left their Sami ethnicity behind – but not their genes – when they moved away to metropolitan areas such as Helsinki, Oslo or Stockholm: do the genetic analyses of the majority populations take this into account and, if so, what role does this factor play in the results? This too could be an issue for other indigenous peoples who have been subjected to assimilation.
Paleolithic Settlement in Eurasia
Did modern humans move westward from Central Asia to Europe during the Paleolithic? Marcel Otte argues: “Central Asia … contains all of the components for the hypothesized dense and rapid migratory movement of anatomically modern humans [Aurignacian culture] toward Europe (2007: 366).” One view of early settlement in Eurasia might propose that humans arrived in Europe before northern Eurasia due to the latter’s colder and drier climate; surprisingly, that does not seem to be particularly accurate. Modern humans settled relatively rapidly in many areas of Eurasia: new radiocarbon calibration curves in the range of 25,000-50,000 BP[3] point to a much speedier dispersal of human populations than was originally thought (Mellars 2006: 933). Between 45,000 and 24,000 years ago they reached as far as 71° north latitude. Aurignacian artifacts buried in volcanic ash dating to ca. 45,000 BP were found at Kostënki (61° north latitude) on the Don River about 250 miles south of Moscow (Anikovich et al. 2007: 223; Hoffecker 2005a: 76-77). The open-air site of Kara–Bom in the Altai at 50° stems from 42,000 BP (Hoffecker 2005a: 77). Human presence was discovered in the European Arctic 35,000-40,000 BP between 58° and 68° along the western flank of the Ural Mountains (Pavlov et al. 2004: 3-5). Artifacts at a site on the Yana River above the Arctic Circle in Siberia at 71° (as high as Europe’s northernmost point) include a foreshaft (part of a dart) and are dated to 27,000 14C years BP (Pitulko et al. 2004). It is not unreasonable to expect that many more sites of comparable age will be found across the relatively uncharted Eurasia. Tuija Rankama and Jarmo Kankaanpää mention “the scarcity of research in the northern parts of Russia and, especially, in Russian North Karelia (2008: 895).”
Last Glacial Maximum
The glaciers began to expand again ca. 28,000 BP and for roughly four millennia hunter-gatherers in the far north resorted to technological innovation (e.g. sewn fur clothing, higher fat/protein diet, portable lamps, heated shelters) to protect themselves from the extreme cold. Such creative abilities were surely linked to their mastery of spoken language and other symbolic systems. Moreover, as John Hoffecker points out, these modern humans did not have the sturdier physique of the Neanderthals, better adapted as it was to the far north (Hoffecker op cit. 71, 81; Hoffecker 2005b: 191). After surviving the increasingly severe conditions for several thousand years humans abruptly abandoned nearly all settlements in Europe and Western Asia and headed for glacial refuges: Franco-Cantabrian in Iberia, the Balkan Peninsula, the Ukrainian near the Black Sea and southern Siberia (Hoffecker 2005a: 94; Wiik 2008: 37). By this time Fennoscandia was covered with a thick ice sheet.
Around 20,000 BP the LGM ended when the ice sheet slowly began to melt. By 16,000-15,000 BP, due to large increases in melt water, sea levels began to rise significantly, this rise continuing until about 7,000 years ago. Flora and fauna gradually moved back into deglaciated areas and were followed by human settlers. Technological innovation continued during and after the cold spell. The spear thrower (21,000 BP), bow and arrow (14,000 BP though undoubtedly earlier), domestic dog (17,340 14C BP at Eliseevichi in the Dnieper River basin – Sablin et al. 2002: 795) and eyed needle (the oldest is from 35,000 BP at Kostënki, some 10,000 years before the first preserved needle in Western Europe – Hoffecker 2005a: 97-98, 166) are examples.
The Mesolithic in Scandinavia
The post-glacial colonization of Scandinavia came from any direction where the peninsula was accessible, southwest to northeast and even directly from the east. The maps below show the ice sheet at 10,000 BP and 9,300-9,200 BP (Eronen et al. 2001: 19). They illustrate how rapidly the ice was shrinking and the avenues by which humans could reach Fennoscandia.
i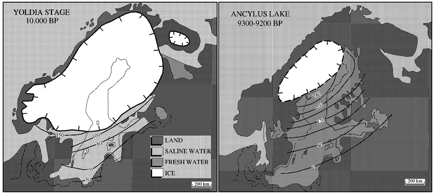
Maps 1, 2 – Two stages of receding glacier in Fennoscandia
By ca. 13,000 BP long stretches of the Norwegian coast were ice-free but, as Hein Bjartmann Bjerck points out, there was “no certain evidence of human settlement in this rich arctic biotope” until near the end of the Younger Dryas (1,300 year cold snap) about 10,000 BP (2008: 65). The earliest evidence of human activity in Scandinavia is during the Early Mesolithic chronozone from 10,020-8,900 BP (9,500-8,000 cal BC); Bjerck lists 37 key sites in Norway (Ibid. 75-78). There were three coastal techno-complexes: the Fosna along the coast of southern Norway, the Hensbacka in southwest Sweden near Bohuslän and the Komsa in northern Norway, all with a forerunner in the late Paleolithic Ahrensburg culture further south (Ibid. 74). The Middle Mesolithic chronozone 8,900-7,690 BP and the Late Mesolithic chronozone 7,690-5,230 BP follow, the latter period witnessing an increase in rock art.
These peoples exploited the abundant marine resources along the diverse and extensive coastlines – the Norwegian shoreline alone counting islands and fjords is some 83,280 km long (Ibid. 70). This would have been impossible to take advantage of without the use of boats, though no remains have been found to date (Ibid. 84). The lack of boat technology might account for the long time span between the freeing of the area from ice and its actual exploitation. The sea’s subsistence potential has always been significant for humans, but where did the maritime adaptation come from? The limited understanding may be attributable to “the dramatic changes in global eustasy during and immediately after the last ice age (Ibid. 85).” Perhaps the maritime adaptation is part and parcel of the Mesolithic development that paralleled the settling of the coastal areas.
The earliest phase of the Hensbacka was 10,300-9,700 BP. Located in central Bohuslän along the Swedish west coast, it had, according to Lou Schmitt et al., the highest density of Late Paleolithic and Early Mesolithic sites in northern Europe. Schmitt et al. argue that these were seasonal Ahrensburg sites representing several Ahrensburg groups (2006: 9). Settlers arrived in southern Finland by 9,300 BP. All of Finland was ice-free by 8,900 BP, and peoples reached northernmost Finland by 8,400 BP or earlier, cf. Sujala below. The oldest find in Finland is perhaps the Antrea fishnet 9,200 BP on the Karelian Isthmus and the Heinola sledge dated at 8,800 BP in southern Finland northeast of Helsinki, both with parallels in the East Baltic and Northwest Russia (Nuñez 2002: 166). The recently excavated Sujala site in the northernmost borough of Finnish Lapland has radiocarbon dates for charcoal samples from ca. 9,265-9140 BP and bone samples from 8,940-7,790 BP, in other words towards the end of Bjørnar Olsen’s Phase I (10,000-9,000 BP) of the settlement of the north Norwegian coast, the settlement originally called Komsa (Olsen 1994). On technological and typological grounds Rankama and Kankaanpää conclude “the Sujala site is not related to the early Ahrensburg-derived Phase I of the North Norwegian coast but rather to the post-Swiderian cultures of Russia and the eastern Baltic (2008: 896).” Since the Sujala dates are much earlier than when peoples reached northern Finland from the south and because of the post-Swiderian nature of the assemblages, the authors mention a possible route from the east; however, they note that there is as yet no archaeological evidence for a route through Russian Karelia or across the White Sea Narrows to the Kola Peninsula.[4]
What were the humans arriving in Scandinavia like and when and whence did they come? Once the deglaciation of Fennoscandia came to an end humans entered the peninsula from all directions and at pretty much all times up to the present. In so doing, they contributed to the gene pool of today’s inhabitants, Finns, Norwegians, Sami and Swedes. The first settlers in Scandinavia were from areas adjacent to the receding glacier, the various Early Mesolithic cultural complexes, post-Ahrensburgian from the southwest and south (e.g. Maglemose reindeer hunters), and post-Swiderian from the south (eastern Poland), the southeast and east (e.g. Kunda living in forested areas and along rivers and hunting elk and mammoth).[5] Some of Finland’s early settlers were from the Kunda complex, transitional between post-Ahrensburgian and post-Swiderian. According to Kalevi Wiik the Ahrensburgian groups came from the east.[6] This might be related to the Ukrainian LGM refuge and the expansion to the northwest from there of the R1a haplogroup after the ice began its retreat – the ultimate origin of R1a is in India (Sahoo 2006). It must be stressed that these were not always migrations per se; the ice was receding only a couple miles per generation, hardly noticeable to the humans involved. Camps such as the Hensbackian, though, may have been seasonal at first with more permanent settlements elsewhere. Wiik further divides the early groups below the ice sheet from west to northeast into future Germans, future Balts, future Slavs, future Finns and South Sami, future North Sami as well as future Volgans, Permians and Ugrians, all of them post-Swiderians and speakers of an early form of Finno-Ugric/Uralic (Ibid. 100-01, 104).
That brings up the issue as to when farming arrived in Scandinavia and whether it was simultaneous with the arrival of Indo-European languages. Conventional wisdom would have agriculture coming to the south coast of Finland and south Sweden around 5,300 BP at the very end of the Ertebølle culture. Farming reached Fennoscandia mainly via cultural diffusion: “When farming arrived in the north along with Indo-European languages the peoples remained largely the same, adopting Germanic, Baltic or Slavic languages, or they kept their Finno-Ugric tongues (Weinstock op cit. 4-5).” Some have suggested an earlier arrival of the I-E languages: Adams and Otte hypothesize that environmental change could have helped I-E languages to spread rapidly by causing changes in population density of hunter-gatherer groups. Two such climatic events would be the 8,200 and 5,900 BP cold spells (Adams & Otte 1999: 76). Perhaps a closer examination of the mtDNA and Y-chromosome data can shed some light on these issues.
Scandinavian Phylogeographic Data I: mtDNA
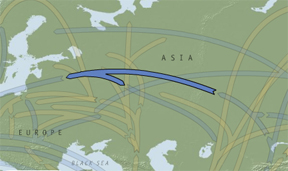
The frequency distribution of mtDNA haplogroups in Fennoscandia and Europe as a whole is laid out in Table 1 below.[7] (Super)haplogroup U consists of the subclades U1-U8; U originated in Western Asia from haplogroup R in the form of a common female ancestor. The U5 subclade is the oldest mtDNA in Europe and goes back to the Ukrainian glacial refuge where it expanded to the north and west after the LGM. Richards et al. give an age range for U in the Early Upper Paleolithic at ca. 50,000 BP. For Scandinavia as a whole they suggest that 79.3% of the migration events are Paleolithic, 11.7% Neolithic and 7.4% Bronze Age/recent (2000: 1266, 1268). Haplogroup K is descended from the U8 subclade and goes back ca. 12,000 years. Map 3 illustrates the expansion of U, U5 and K after the LGM north of the Caucasus Mountains into Europe 20,000-25,000 BP.[8]
Map 3 – Expansion of haplogroups U, U5 and K.
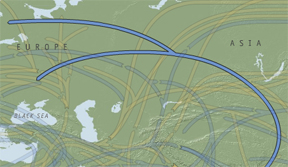
Superhaplogroup HV and its descendants H and V originated in Western Eurasia some 30,000 years ago when one branch of HV ancestors moved north across the Caucasus and then north and west, reaching its highest concentration among Estonians, Finns and Sami. Richards et al. give an age range for HV, the parent of V, of Middle Upper Paleolithic (2000: 1266). Eva-Liis Loogväli et al. provide coalescence ages for haplogroup H subclusters ranging from 23,800 to 6,000 (2004: 2014). H is easily the largest haplogroup in Europe as evident in the table below. The subclades H1 and H3 as well as haplogroup V took refuge during the LGM in the Franco-Cantabrian area while other subclades of H went to the Ukrainian and Italian refuges. After the LGM some of the descendants from the Iberian refuge headed north crossing the North Sea, the southern part of which was dry land – Doggerland – in the early Mesolithic, to what is now Southern Sweden and the West Norwegian coast. Two separate arms of HV can be seen in Map 4 below (Ibid.). The group of descendants of the maternal ancestor of HV that headed north over the Caucasus became the progenitors of H and V. Richards et al. estimate the age of H at ca. 16,500 (2000: 1266).
Map 4 – Separate arms of haplogroup HV.
Haplogroup T, which appeared about 10,000 BP, is common in eastern and northern Europe. It is also found in the Indus Valley and the Arabian Peninsula and may be tied to the Neolithic expansion of farmers.
Haplogroup Z stems from Central Asia between the Caspian Sea and Lake Baikal. It has its highest frequency in Russia and among some Sami groups. The Sami Z lineage shares a common ancestor with groups in Finland and the Volga-Ural area of Russia and must be quite recent (2,700 BP) because it differs from Northeast Asian Z representatives (Ingman and Gyllensten: 115, 119).
Haplogroup D also arose in the Lake Baikal area and is the predominant maternal haplogroup in East Asia. It is an old lineage, some 60,000, and was one of the maternal haplogroups that found its way to the New World.
Table 1 – Contemporary mtDNA data for the Nordic countries.
|
Country\Haplogroup |
U |
K |
H |
V |
T |
Z |
D |
Other |
|
Finland1 |
27.5 |
6.5 |
40 |
4.5 (HV0) |
6 |
|
|
|
|
Finland2 |
27.9 |
2.5 |
40.1 |
5.1 |
2.5 |
2.5 |
0 |
|
|
Central Finland |
|
|
|
|
|
|
|
|
|
Northern
Ostrobothnia3 |
34 |
3 |
34 |
6 |
8 |
|
|
3 (M)8 |
|
Country\Haplogroup |
U |
K |
H |
V |
T |
Z |
D |
Other |
|
Kainuu3 |
36 |
2 |
37 |
9 |
1 |
|
|
6 (M)8 |
|
Northern Savo3 |
17 |
4 |
53 |
4 |
1 |
|
|
1 (M)8 |
|
Central
Ostrobothnia3 |
25 |
3 |
39 |
3 |
0 |
|
|
0 (M)8 |
|
Southern Finland |
|
|
|
|
|
|
|
|
|
Häme1 |
16.7 |
13.3 |
43.3 |
6.7 (HV0) |
6,7 |
|
|
|
|
Karjala1 |
43.3 |
3.3 |
30 |
3.3 (HV0) |
3.3 |
|
|
|
|
Pohjanmaa1 |
33.3 |
6.7 |
40 |
6.7 (HV0) |
3.3 |
|
|
|
|
Satakunta1 |
23.3 |
0 |
46.7 |
10 (HV0) |
6.7 |
|
|
|
|
Savo1 |
26.7 |
3.3 |
43.3 |
0 |
6.7 |
|
|
|
|
Varsinais-Suomi1 |
13.3 |
13.3 |
33.3 |
3.3 (HV0) |
10 |
|
|
|
|
Karelia2 |
26.9 |
1.6 |
46.7 |
5.5 |
3.8 |
.4 |
3.7 |
|
|
Norway4 |
16 |
|
29 |
4 |
9 |
|
|
|
|
Sapmi
– Norway5 |
56.8 |
0 |
4.7 |
33.1 |
.4 |
0 |
2.9 |
|
|
Norway6 |
57.6 |
|
4.7 |
33.1 |
.4 |
0 |
2.9 |
|
|
Finland5 |
40.6 |
0 |
2.9 |
37.7 |
0 |
7.2 |
8.7 |
|
|
Finland6 |
43.5 |
0 |
2.9 |
37.7 |
0 |
7.2 |
8.7 |
|
|
N. Sweden5 |
35.5 |
0 |
2.6 |
58.6 |
.7 |
.7 |
0 |
|
|
S. Sweden5 |
18.8 |
9.4 |
34.8 |
18.1 |
2.2 |
4.3 |
0 |
|
|
S. Swed.
Traditional5 |
23.9 |
4.3 |
15.2 |
37 |
2.2 |
10.9 |
0 |
|
|
S. Swed.
Non-traditional5 |
16.3 |
12 |
44.6 |
8.7 |
2.2 |
1.1 |
0 |
|
|
Sweden6 |
26.5 |
|
3.1 |
68.4 |
0 |
1.0 |
0 |
|
|
Sweden2 |
21 |
7.5 |
45.6 |
1.3 |
10.1 |
.3 |
0 |
|
|
Sweden7 |
17.9 |
5.9 |
41.2 |
2.8 |
7.8 |
|
.7 |
|
|
Norrland7 |
25.7 |
4.5 |
39.2 |
2.6 |
5.2 |
|
.4 |
|
|
Country\Haplogroup |
U |
K |
H |
V |
T |
Z |
D |
Other |
|
Svealand7 |
18.3 |
5.6 |
39.3 |
2.2 |
7.5 |
|
1.1 |
|
|
Götaland7 |
14.2 |
6.7 |
39.6 |
3.4 |
9.1 |
|
.5 |
|
|
Continental Europe5 |
2.6 |
9.3 |
46.9 |
4.4 |
10.8 |
0 |
0 |
|
Notes: Empty cell = no data for this haplogroup.
Sources: 1Hedman et al.
2007; 2Lappalainen et al.
2008; 3Meinilä et al.
2001; 4Passarino et al.
2002; 5Ingman et al. 2007;
6Tambets et al. 2004; 7Lappalainen
et al. 2009; Meinilä et al. point out that much of what had
been assigned to macrohaplogroup M and haplogroup V belonged to haplogroup Z.
What can be gleaned from the mtDNA table above? First of all, haplogroup U, which includes the Sami motif U5b1b1, displays significant variation both within the majority population of Sweden (insufficient data for Norway) as well as within the various Sami groups. There is a cline or geographical gradient running north to south with the highest U in the north: among majority Swedes the frequency is 25.7% in Norrbotten falling to 14.8% in Götaland; the frequency goes from 57.6% for Norwegian Sami to 18.8% for Southern Swedish Sami nontraditional (not involved in reindeer herding). Finns and Karelians have a frequency of roughly 27%. The Norwegian U frequency is 16%. Comparing this to the Continental European U frequency of 2.6% a substantial amount of admixture can be seen among all the Scandinavian populations. How is this to be explained? Maria Meinila et al. refer to admixture due to the high frequency of Sami specific mtDNA haplotypes in majority Finns (2001: 160). Max Ingman and Ulf Gyllensten attribute admixture among southern Swedish Sami to their stratification on the basis of occupation (2007: 117). However, a different issue may be at play here: the extent of admixture in the majority populations adumbrates assimilation as alluded to above. The Sami were subjected to assimilation pressure from the majority governments during the 19th and first half of the 20th centuries so severe that the most convenient solution for many Sami was internal migration to majority areas. The assimilation, though, goes back much further to when some Sami nomads settled along the coasts of the Atlantic Ocean and the Gulf of Bothnia many centuries ago. There was intermarriage and the subsequent exchange of genes. Genetic studies of the majority Scandinavian populations do not often discuss this issue. For example, Giuseppe Passarino et al. collected their DNA from 74 young men drafted into the Norwegian army. They do not go into details about their sample in the extensive discussion of their results (2002: 522-26, 528). But there are hints in the literature: Berit Myhre Dupuy et al. mention that the Y-chromosome N3 in Norway “is observed at 4% in the overall population and at 11% in the northern region corresponding to 150,000 and 50,000 inhabitants, respectively. These numbers exceed the total number of Saami inhabitants (2006: 6). Tuuli Lappalainen et al. (2008: 62, 71), though, discuss internal immigration, mentioning “a possible ethnic association to the indigenous Saami people” and that “the biggest cities harbored clear traces of immigration from all over the world.” When sampling majority populations of the countries where the Sami reside it would seem essential to consider their recent and earlier socio-political history.
Haplogoup K distribution is clinal in Finland and Sweden with smaller frequencies to the north, though the sample size is possibly not statistically significant for Finns. Haplogroup H, the most common mtDNA haplogroup in Europe at an average frequency of 46.9%, is, as expected, much lower among Sami except for Southern Swedish nontraditional Sami. The frequency of H among Norwegians is rather low at 29%; whether this is due to sample size or admixture cannot be determined from the available data. Haplogroup V, on the contrary, has a high frequency among Sami groups except for Southern Swedish nontraditional Sami and shows clinal behavior, highest in the north and lowest in the south. V among the Sami is primarily due to expansion from the Franco-Cantabrian glacial refuge (Tambets et al. 2004: 676.). T has its highest frequencies in Southern Scandinavia where farming first arrived. Though T is present during the Paleolithic it arrived in Eurasia from the southeast beginning 10,000 BP and is mainly thought of as a Neolithic agro/pastoralism expansion.
Haplogroup Z originated in Siberia and spread from there in several directions. The spread westward was originally thought to have come to a halt around the Ural Mountains, but Ingman and Gyllensten found substantial frequencies of Z among the Finnish Sami and Southern Swedish traditional Sami suggesting that some Sami lineages shared a common ancestor with lineages from the Volga-Ural region as recently as 2,700 years ago (Op cit. 115, 119). Yet, the distribution of Z throughout Scandinavia seems to have implications beyond its presence in the Sami. Although the percentages of Z in the majority populations are quite small ranging from .3-.4% for Sweden (Lappalainen et al. 2008 and Tambets et al. 2004) to 2.5% for Finland (Lappalainen et al. 2008), this compares to no Z at all in Germany, Poland, the Balkans and all of Western Europe. Hence, the Finns, Norwegians and Swedes likely acquired Z through assimilation of the Sami and subsequent admixture. Looking at the numbers, a very crude estimate of the number of Swedes carrying Z mtDNA is 275,000, which is several orders of magnitude greater than the number of Sami in Sweden.
Scandinavian Phylogeographic Data II: Y-Chromosome
The frequency distribution of
Y-chromosome haplogroups in Fennoscandia and Europe as a whole is laid out in
Table 2 below.[9] The main
haplotypes represented are I1, N1c ( the old N3) and R1. Haplogroup I1 is
common in Europe and has it highest frequency in Scandinavia and the Balkans. It
originated at the beginning of the LGM some 22,000 BP, probably when some
groups went to the Ukrainian refuge near the Black Sea and others to the refuge
in the Balkans. Hammer and Zegura give an age of mutation for I at
5,950±2,450 (2002: 314). Rootsi et al.
have times since divergence of 15.9±5.2 for I1a, 10.7±4.8 for I1b* and 14.6±3.8
for I1c (2004: 135). When the ice began to melt, those carrying
the I haplogroup expanded to the northwest in the form of three subclades I1a
(most common in Scandinavia), I1b (common in the Balkans and Eastern Europe)
and I1c (which has its highest frequency in Germany at ca. 11%). Clade I is
widespread in Europe and mostly absent elsewhere.[10] This
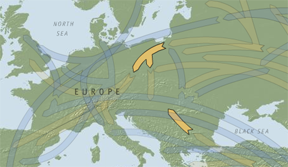
expansion can be seen in Map 5.
Map 5 – expansion of haplogroup I.
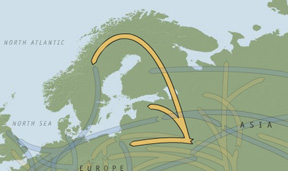
Haplogroup N first appeared in Southeast Asia15,000-20,000 BP and today it is “mainly found in Northern Eurasia and is absent or only marginally present in other regions of the globe (Ibid. under Clade N).” The subclade N1c1 is especially frequent among Finns and Lithuanians. Siiri Rootsi et al. give a convergent time estimate for N (with data combined from the old designations N1-N3) of 19.4±4.8 (evolutionary
Map 6 – Expansion of haplogroup N.
time) and 5.8±1.4 (pedigree-based time) (2004: 135). Map 6 depicts the expansion of N.
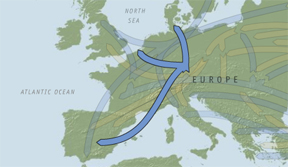
Haplogroup R dates back to just after the onset of the last ice age at 26,800 BP. The subclade R1a is most common in the Eurasian steppe and may have expanded from the Ukrainian refuge. Subclade R1b expanded from the Franco-Cantabrian refuge after the LGM and is very common in Western Europe among other areas. The coalescent time for R is 16,300±4,430 according to Hammer and Zegura (2002: 314). Map 7 illustrates the expansion of R from its Central Asian place of origin.
Map 7 – Expansion of haplogroup R1.
Table 2 – Contemporary Y-chromosomal data for the Nordic countries.
|
Country\Haplogroup |
I |
I1a |
I1b |
I1c |
N1c |
R1a |
R1b |
J |
Other |
|
Finland1 |
28.9 |
|
|
|
63.2 |
7.9 |
|
|
|
|
Eastern Finland3 |
|
19 |
0 |
.7 |
70.9 |
5.9 |
2.6 |
0 |
.3 R* |
|
Western Finland3 |
|
40 |
.4 |
.9 |
41.3 |
8.7 |
5.2 |
0 |
.9 DE |
|
Österbotten4 |
|
20 |
|
|
65 |
7.5 |
2.5 |
|
5 G |
|
Karelia3 |
|
15.2 |
2.3 |
0 |
53 |
25 |
.8 |
0 |
|
|
Norway1 |
40.3 |
|
|
|
6.9 |
23.6 |
27.8 |
|
|
|
Norway5 |
|
|
37.3 |
|
3.8 |
26.3 |
31.3 |
|
|
|
North Norway5 |
|
|
34.7 |
|
10.6 |
27.1 |
26.8 |
|
|
|
Country\Haplogroup |
I |
I1a |
I1b |
I1c |
N1c |
R1a |
R1b |
J |
Other |
|
Middle Norway5 |
|
|
39.7 |
|
trace |
31.5 |
27.1 |
|
|
|
South Norway5 |
|
|
42.1 |
|
trace |
13.2 |
44.7 |
|
|
|
Sapmi – Sami1 |
25.9 |
|
|
|
47.2 |
11 |
3.9 |
|
|
|
Finnish Sami1 |
40.6 |
|
|
|
55.1 |
2.9 |
1.4 |
|
|
|
Kola Sami1 |
17.4 |
|
|
|
39.1 |
21.7 |
8.7 |
4.3 |
8.7 E |
|
Swedish Sami1 |
31.4 |
|
|
|
37.1 |
20 |
5.7 |
|
|
|
Swedish Sami4 |
31.6 |
|
|
|
44.7 |
15.8 |
7.9 |
3.6 |
3.3 P* |
|
Sweden3 |
|
35.6 |
0 |
1.9 |
14.4 |
24.4 |
13.1 |
0 |
4.4 F*/P* |
|
Sweden1 |
48.2 |
|
|
|
2.8 |
18.4 |
22 |
|
|
|
Sweden2 |
|
38.2 |
3.6 |
3.2 |
5.9 |
15.7 |
20 |
|
5.1 DE |
|
Sweden4 |
|
37 |
|
5 |
9.5 |
11.8 |
23.6 |
3.6 |
3.6 I1c |
|
Norrland2 |
|
39.8 |
3.3 |
5.7 |
6.5 |
13 |
16.3 |
|
|
|
Västerbotten4 |
|
24.4 |
|
17 |
19.5 |
12.5 |
15 |
|
|
|
Svealand2 |
|
36.3 |
2.8 |
2.3 |
7.9 |
13.2 |
19.8 |
|
|
|
Gotland4 |
|
45 |
|
5 |
10 |
12.5 |
15 |
0 |
5 P*, K* |
|
Götaland2 |
|
39.6 |
4.6 |
3.3 |
3.6 |
14.2 |
21.6 |
|
|
|
Continental
Europe1 |
26.5 |
|
|
|
16 |
26.4 |
16 |
|
Q .23 |
Notes: Empty cell = no data for this haplogroup.
Sources: 1Tambets et al.
2004; 2Lappalainen et
al. 2009; 3Lappalainen et
al. 2008; 4Karlsson et al.
2006; 5Dupuy et al. 2006;
Dupuy et al. has P*(xR1a) and BR(xDE,
J, N3, P) as two of the four major Y-chromosomal haplogroups in Norway. The
former is mainly R1b and the latter mainly I1b. The figures for Continental
Europe are a very crude estimate that does not take population size into
consideration.
What patterns can be observed? In the case of I
there appears to be a cline running northeast to southwest with the highest
values generally to the southwest: Western Finland with a frequency of 40%,
Gotland 45, and South Norway 42.1, though Norrland in Sweden is an exception,
perhaps due to ethnic association with Northern Finland (cf. Lappalainen et al.
2009:62). The figures for the Western Finnish Sami and Swedish Sami are
comparable to those for the majority populations, whereas Eastern Sami in Kola
and the Karelians are significantly lower. Croats, Germans and Hungarians also
have relatively high levels of I.
Haplogroup N seems to have arisen in Northern
China/Mongolia from where it spread into Siberia and the Baltic. Its descendant
N1c is widespread in the Baltic region and was brought by small groups of males
speaking an early Uralic language. There is a clear distinction between the
Eastern Finns and the Sami vs. those living further to the west with the former
having high values of N1c. Österbotten in Western Finland, though, has a very
high frequency too; this could be related to contacts with Norrland as above.
North Norway has a higher value than most other majority groups, with the
exception of Finland, and this may be due to admixture with the Sami. Three
areas of Sweden show fairly high values with an east-west cline, 3.6% for
Götaland to the south and 7.9% for Svealand just north of Götaland and Gotland
off the east coast of Sweden with 10%. Surprisingly, perhaps, the figure for
Norrland is only 6.5% whereas Västerbotten has 19%. Lappalainen et al. suggest historical ties to
Finland where N1c is very common (2009: 70). Berit Myhre Dupuy et al. mention that the Y-chromosome N3
in Norway “is observed at 4% in the overall population and at 11% in the
northern region corresponding to 150,000 and 50,000 inhabitants, respectively.
These numbers exceed the total number of Saami inhabitants” (2005: 6). Dupuy et al. continue: “There is thus a
considerable pool of Saami and/or Finnish [Kven] Y-chromosomes in the Norwegian
population and particularly in the north (ibid.
6,8).” 4% of Norway’s population of ca. 5 million would be 190,000, the number
of Norwegians carrying N1c.
The R1a frequency is lowest among the Finns and the
Sami, though the Kola Sami and the Swedish Sami have values comparable to most
of the majority population in Sweden. R1a is highest in Middle and North Norway
with South Norway similar to most of Sweden, but there is insufficient data to
come to any firm conclusions. R1b has a much higher frequency in South Norway
than in Sweden; this might indicate some admixture between the Swedes and Sami
of Sweden.
Conclusions
Geographical heterogeneity among the Sami is readily
apparent in the mtDNA and Y-chromosomal data in the tables above; such
heterogeneity is also to be found among the majority populations in Scandinavia.
Discussing the Norwegian population Dupuy et
al. observe that the “[h]eterogeneity in major founder groups, geographical
isolation, severe epidemics, historical trading links and population movements
may have … contributed to the observed regional differences in distribution of
haplotypes (2006: 1).” Ingman and Gyllensten (2007: 117)) present one of the
best examples to date of admixture, viz. the Southern Swedish Sami
nontraditional who are much more “Swedish” than Sami. This heterogeneity surely
had much to do with the harsh, official Norwegian assimilation policy, the Swedish
segregation policy that led to many Swedish Sami becoming assimilated and
comparable policies in Finland. But human groups have oftentimes been in
contact with one another, and this has inevitably resulted in genetic admixture
for which Scandinavia provides plenty of evidence.
Bibliography
Adams, Jonathan and Marcel Otte. (1999) “Did Indo-European Languages Spread Before Farming?” The Wenner-Gren Foundation for Anthropological Research: 73-77.
Anikovich, M. V. et al. (2007) “Early Upper Paleolithic in Eastern Europe and Implications for the Dispersal of Modern Humans.” Science Vol. 315. no. 5809: 223 – 226
Bjerck, Hein Bjartmann. (2008) “Norwegian Mesolithic Trends: A Review.” Mesolithic Europe. Cambridge: Cambridge University Press.
Dupuy, Berit Myhre et al. (2005) “Geographical heterogeneity of Y-chromosomal lineages in Norway.” Forensic Science International 164(1):10-19.
Eronen, M. et al. (2001) “Rates of Holocene isostatic uplift and relative sea-level lowering of the Baltic in SW Finland based on studies of isolation contacts.” Boreas 30: 17-30.
Hammer, Michael F. and Stephen L. Zegura (2002) “The Human Y Chromosome Haplogroup Tree: Nomenclature and Phylogeography of Its Major Divisions.” Annual Review of Anthropology 32: 303-21.
Hedman, Max et al. (2007) “Finnish mitochondrial DNA HVS-I and HVS-II population data.” Forensic Science International 172: 171-78.
Hoffecker, John F. (2005a) A Prehistory of the North. New Brunswick: Rutgers University Press.
— (2005b) “Innovation and Technological Knowledge in the Upper Paleolithic of Northern Eurasia.” Evolutionary Anthropology 14: 186-98.
Ingman, Max and Ulf Gyllensten. (2007) “A recent genetic link between Sami and the Volga-Ural region of Russia.” European Journal of Human Genetics 15: 115-20.
Karafet, Tatiana et al. (2008) “New binary polymorphisms reshape and increase resolution of the human Y chromosomal haplogroup tree.” Genome Research 2008 May; 18(5): 830–838.
Karlsson, Andreas et al. (2006) “Y-chromosome diversity in Sweden – A long-time perspective.” European Journal of Human Genetics 14: 963-70.
Lappalainen, Tuuli et al. (2008) “Migration Waves to the Baltic Sea Region.” Annals of Human Genetics 72: 337-48.
— (2009) “Population Structure in Contemporary Sweden––A Y-Chromosomal and Mitrochondrial DNA Analysis.” Annals of Human Genetics 73: 61-73.
Loogväli, Eva-Liis et al. (2004) “Disuniting Uniformity: A Pied Cladistic Canvas of mtDNA Haplogroup H in Eurasia.” Molecular Biology and Evolution 21(11): 2012-21.
Meinilä, Maria et al. (2001) “Evidence for mtDNA Admixture between the Finns and the Saami.” Human Heredity 52: 160-70.
Mellars, Paul. (2006) “A new radiocarbon revolution and the dispersal of modern humans in Eurasia.” Nature 439, 931-35.
Nuñez, Milton. (2002) “Finland’s Settling Model Revisited.” Mankind Quarterly Vol. XLIII Nr. 2: 155-75.
Olsen, Bjørnar. (1994) Bosetning og samfunn I Finnmarks forhistorie. Oslo: Universitetsforlaget.
Otte, Marcel. (2007) “Arguments for Population Movement of Anatomically Modern Humans from Central Asia to Europe.” Rethinking the human revolution. Ed. Paul Mellars et al. McDonald Institute Monographs, McDonald Institute for Archaeological Research.
Passarino, Giuseppe et al. (2002) “Different genetic components in the Norwegian population revealed by the analysis of mtDNA and Y chromosome polymorphisms.” European Journal of Human Genetics 10: 521-29.
Pavlov, Pavel et al. (2004) “The Pleistocene colonization of northeastern Europe: a report on recent research.” Journal of Human Evolution 47: 3-17.
Pitulko, V. V. et al. (2004) “The Yana RHS Site: Humans in the Arctic Before the Last Glacial Maximum.” Science Vol. 303: 52-56.
Rankama, Tuija & Jarmo Kankaanpää. (2008) “Eastern arrivals in post-glacial Lapland: the Sujala site 10 000 cal BP.” Antiquity 82: 884-99.
Richards, Martin et al. (2000) “Tracing European Founder Lineages in the Near Eastern mtDNA Pool.” American Journal of Human Genetics 67: 1251-76.
Rootsi, Siiri et al. (2007) “A counter-clockwise northern route of the Y-chromosome haplogroup N from Southeast Asia towards Europe.” European Journal of Human Genetics 15, 204-11.
— (2004) “Phylogeography of Y-Chromosome Haplogroup I Reveals Distinct Domains of Prehistoric Gene Flow in Europe.” American Journal of Human Genetics 75: 128-37.
Sablin, Mikhail V. and Gennady A. Khlopachev. (2002) “The Earliest Ice Age Dogs: Evidence from Eliseevichi I.” Current Anthropology 43, no. 5: 795-99.
Sahoo, S. et al. (2006) “A prehistory of Indian Y chromosomes: Evaluating demic diffusion scenarios.” vol. 103, no. 4.
Schmitt, Lou et al. (2006) “’Why They Came’; The Colonization of the Coast of Western Sweden and Its Environmental Context at the End of the Last Glaciation.” Oxford Journal of Archaeology 25(1): 1-28.
Tambets, Kristiina et al. (2004) “The Western and Eastern Roots of the Saami––the Story of Genetic “Outliers” Told by Mitochondrial DNA and Y Chromosomes.” American Journal of Human Genetics 74: 661-82.
Timofeev, V. I. et al. (2004) “The Radiocarbon Datings of the Stone Age – Early Metal Period On the Karelian Isthmus.” Geochronometria Vol. 23: 93-99.
Weinstock, John. (Forthcoming 2009) “Thoughts About Saami Prehistory.” In “Samar som “den andre”, samar om “den andre”: Identitet og etnisitet i nordiske kulturmøte.”
Wiik, Kalevi. (2006) “Who Are the Finns?” A Man of Measure: Fstschrift in Honour of Fred Karlsson on his 60th Birthday (A Special Supplement to Journal of Linguistics 19): 97-108. Turku: The Linguistic Association of Finland.
— (2008) “Where Did European Men Come From?” Journal of Genetic Genealogy, 4:35-85.