|
Trajectory Tool
Tutorial
Step 1.
Load the trajectory tool.
|
After
selecting the trajectory tool button, allow the
trajectory tool to fully load in your browser. If you
are using a dial-up connection, it may take several
seconds to see the loading bar. The map will not be
ready for use until the loading bar reaches 100%.
The
trajectory tool has been designed for a 1024 X 768
screen resolution to provide sufficient map detail. The image below displays how the
entire trajectory tool should appear in your web
browser. If you load the tool and it does not fully fit
into your browser window, we suggest that you
temporarily increase your computer's video resolution.
For instructions on how to do this
click here.
 |
Step 2.
Select the start location.
|
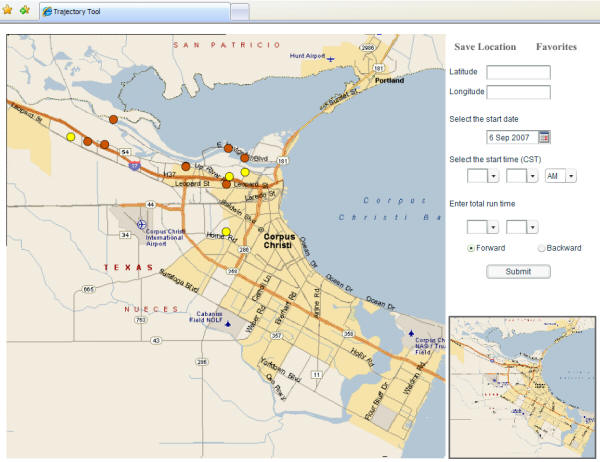
If you know the latitude and longitude
coordinates of your start location, you can
simply enter those numbers into the labeled text
boxes as displayed in the illustration to the
right. |
 |
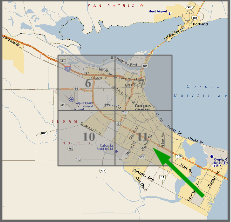
To
select your start location by clicking on the map, begin
by moving your cursor over the small map until the
shaded area is over
the geographic area of interest.
Click
the shaded area and it will load into the large map.
You may then zoom a second time by clicking on a
numbered quadrant (1-16) that appears in the thumbnail
map. The fully zoomed quadrant will then load into
the large map. In the example above, we first
chose the middle shaded area, then quadrant number 11.
If you make a mistake and enter the wrong quadrant on
either zoom level, simply click the text labeled "Zoom
Out" (located directly above the thumbnail map) and try
again.
After successfully loading the zoomed street level map
into the large map area, you are ready to choose your
desired start location. Notice that when you click a
location on the map, it loads the latitude and longitude
coordinates in the text boxes for you. If you
mistakenly clicked the wrong location, you can select
another point on the map and the longitude and latitude
coordinates will be updated automatically in the text
boxes. |
Step 3. Optional: View
the monitoring site labels.
|
The red and yellow dots on the map
indicate the locations of monitoring stations that
collect wind data used to generate the trajectories. To identify
each monitoring station, hold the cursor over the
station location for a few seconds and a label will
pop-up with the name and CAMS number for
that monitoring site. |
 |
Step 4.
Select the
start date.
|
Click the box to the right of the date field to drop
down the monthly calendar. Use the arrows to scroll the
months. Click on the day from the appropriate month and
year. The pull down calendar will disappear and the
selected date should now be displayed in the date test
box. |
 |
Step 5. Select the
start time.
|
Use
the arrow keys to choose the start time for the
trajectory calculation. |
 |
Step 6.
Set the run
time (in hours).
|
The run
time is the length of time you want the trajectory to
run.
Example 1:
If you choose a "forward" trajectory and your start time
is 5:00pm, the trajectory tool will calculate a
trajectory that begins at 5:00pm and moves forward in
time until 6:00pm.
Example 2:
If you choose a "backward" trajectory and your start
time is 5:00pm, the trajectory tool will calculate a
trajectory that begins at 5:00pm and moves backward in
time until 4:00pm.
|
 |
Step 7.
Select the
trajectory type.
|
Next
you need to determine if you want a "forward" or
"backward" trajectory:
-
A
forward trajectory provides an estimate of the path that
air followed moving forward in time beginning at the
start location. Forward trajectories are often used to
answer the question: “Where did the air go?”
-
A
backward trajectory provides an estimate of the path
that air followed prior to arriving at the start
location. Backward trajectories are often used to
answer the question: “Where did the air come from?”
|
 |
Step 8.
Create the
trajectory.
Now
that you have chosen your start location, start date, start
time, and run time and
selected either the forward or backward
trajectory option, click the
submit button to generate the trajectory. After the
trajectory is complete, you can zoom in by clicking on
the quadrants, or zoom out by clicking on the “Zoom out”
button located over the thumbnail map. The trajectory
you just created will remain on all maps until you
either refresh the browser or resubmit a new trajectory. |
 |
|
The
green dots along the trajectory path show the calculated
locations at 5-minute intervals. The trajectory
locations are labeled at 15-minute intervals beginning
at the start time.
The diameters of the
trajectory position labels grow linearly at a rate of
one mile per hour to provide a visual estimate of the
uncertainty in the trajectory position as a function of
time.
To
print, select "file" then "print" in the browser menu
and print page just as you would any web page.
For a
full discussion of how the trajectory is calculated,
click here.
|
Step
9. Optional:
Save/Bookmark location.
|
Save
Location Feature:
-
To
bookmark the start location for future use, click
the "Save Location" link to save the latitude and
longitude coordinates.
|
 |
Step
10. Optional:
Favorites.
|
Favorites
Feature:
-
When returning to the map click "Favorites" to
recall previous start locations.
-
A
window will open with the name, longitude and
latitude of the saved locations. Select the
name of the location you want to pin point on the
map and click "OK". You will return to the map
and the start point will now reflect your saved
location.
|
 |
 |
Step
11. Optional:
Export trajectory coordinates.
|
Export
Feature:
-
To
export the longitude and latitude coordinates of the
trajectory, click the "Export" button that appears
after the trajectory is run.
|
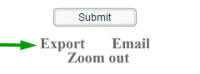 |
Step 12. Optional:
Email trajectory.
|
Email
Feature:
-
To email the trajectory to another person, click the
"Email" button to create a link with all of the
attributes to recreate the trajectory on another
machine. Both the "Email" and "Export" buttons
appear only after the trajectory is run.
|
 |
If
you have any comments, questions, or problems with the web
interface or the operation of the tool, please email
Denzil Smith. If you have technical questions about
the data and calculation methodology used to generate
the trajectory, email
Gary McGaughey. Click
here to go to the trajectory tool. Enjoy! |
|